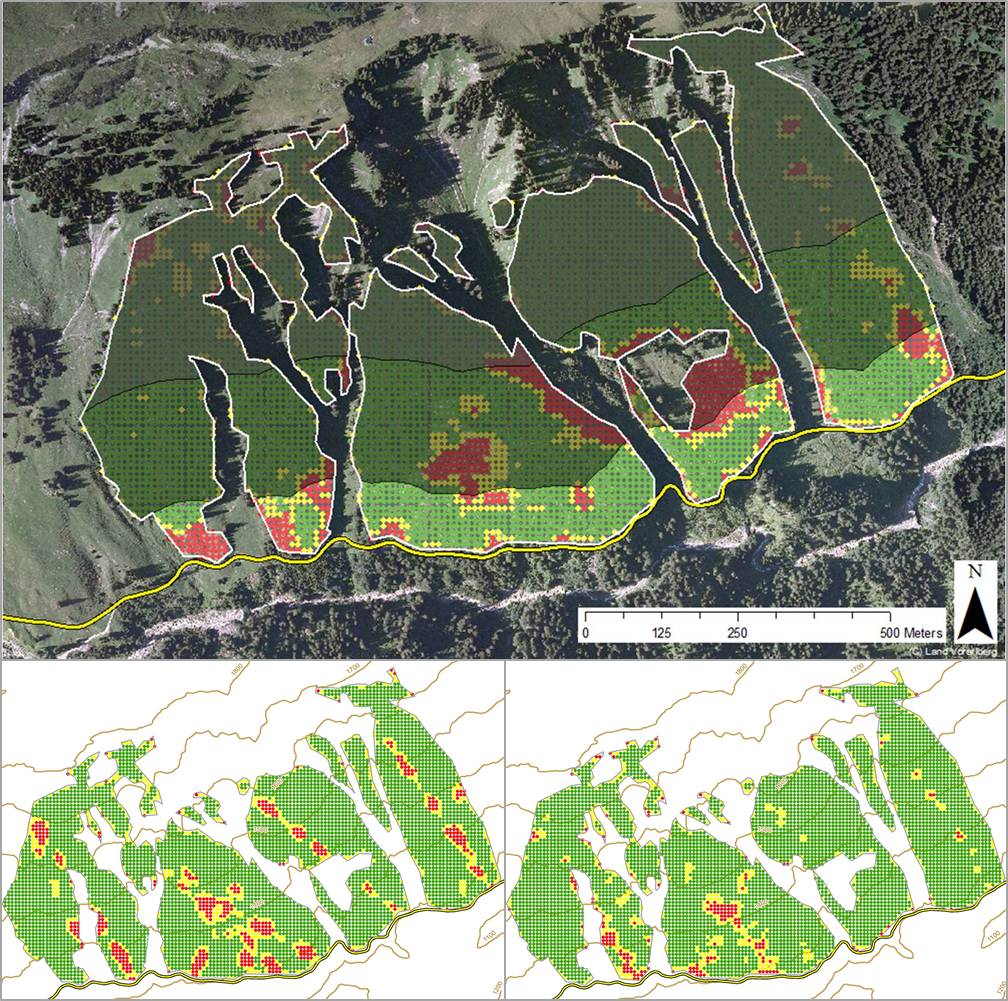
Figure MO-8: Visualization of the protection efficiency against landslides for the current forest conditions (year 2010, on top). The road (displayed at the bottom of the map; yellow line) is the object to be protected. The white lines delineate the analysis area. The results of the assessment are presented as colored pixels (a) green (optimal requirements met), (b) yellow (minimal requirements met) and (c) red (requirements not met). The shading of the map increases with distance from the road (<100 m - no shading; 100-300 m - light grey shading; >300 m dark grey shading). Bottom left hand side: the protection against landslides for the current management under climate change in the year 2100 is shown. Bottom right hand side: results for the recommended management under climate change in the year 2100.