Learn more about the tool “Vulnerablity Assessment (BASIC)” here
Conceptual Approach
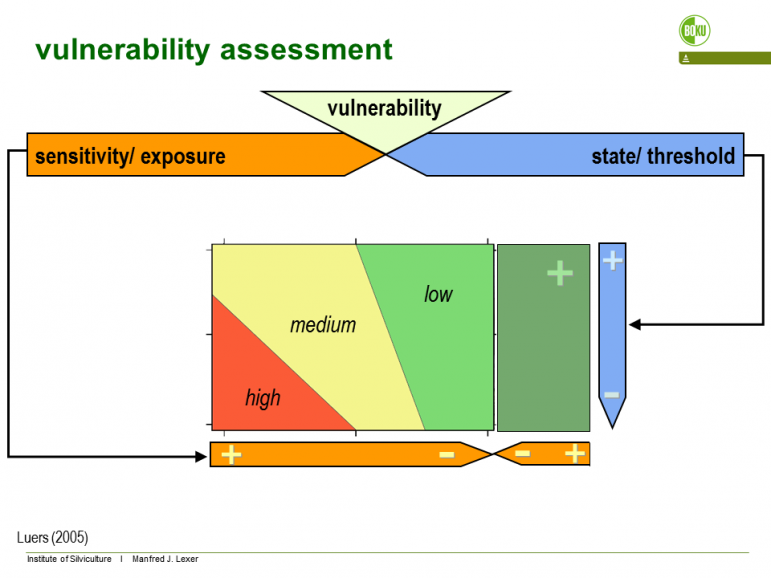
Figure 1. Conceptual representation of the vulnerability surface. The total perceived impact is aggregated from impacts on indicators that are available from forest ecosystem simulations. Values on the y-axis (adaptive capacity) are derived from user input.
The two-dimensional vulnerability surface can be collapsed to a one-dimensional sensitivity index and thus the need to provide user input on adaptive capacity is dropped. To evaluate the sensitivity indicators on a dimensionless scale [0-1] thresholds for recognition and tolerance of an impact must be defined for all indicators. In the manager variant these thresholds are fixed while the analyst variant of the Vulnerability Assessment Tool allows access to advanced features of the tool where thresholds and underlying preference functions which transfer the original measurement scale of the sensitivity indicators into a dimensionless index [0-1] can be adjusted according to specific stakeholder needs. Applying additive value functions from multi-criteria methodology the indicators can be aggregated at the level of ecosystem services, or across all involved services to yield an overall “multifunctional” vulnerability index. For details we refer to Seidl et al. (2011) and Lexer and Seidl (2009).
Literature
Seidl, R., Rammer, W., Lexer, M.J. 2011. Climate change vulnerability of sustainable forest management in the Eastern Alps.Climatic Change 106:225–254
Füssel, H.M., Klein, R.J.T. 2006. Climate change vulnerability assessments: an evolution of conceptual thinking. Clim Change 75:301–329
Usage hints and guides
The application of the vulnerability assessment tool is split into three general steps: First, the cases for analysis are selected. Secondly, the value-based preferences of the user or user group are defined, and the third step is the interactive analysis of the results.
- The cases for analysis can be selected based on the available metadata in the database. For instance, a user may be interested in forest stands that are dominated by beech at sites with a poor water supply. The selection can be further explored in geographical or in biophysical space using an integrated map or via diagrams.
- The available indicators in the database are grouped into ecosystem services (e.g., timber production, biodiversity, risks). In the second step, the task of the user is to select relevant ecosystem services and assign weights reflecting the relative subjective importance of the indicator/ ecosystem service.
- Step three, the analysis of results, is organized along four pre-defined questions, such as “What is the predicted impact of climate change under current management (BAU – business as usual)?” or “What is the effect of switching to alternative management under climate change?”. The results which are then presented show the expected impact on the provisioning of ecosystem services under climate change for the selected cases. The underlying preference information (Step 2) is used to calculate these impacts. See also the concepts sections.
Quick start instructions
- Start the tool, and go to section “SELECT CASES”
- Expand boxes in the toolbar (left) and select cases. A simple start is to open the “Filter by casestudy” box and to tick a case study (e.g., AT01: Central Alpine Case) – this effectively selects all available cases of the whol case study. You can find further help in the “Help” boxes and following the “Learn more” links.
- Go to “DEFINE PREFERENCES”. The most simple case (all weights equal) is selected as the default. Click on the “Save this pattern” button at the bottom of the screen.
- Go to “ANALYZE RESULTS” and select a question. Find more help following the “Learn more” links.
Screenshots
-
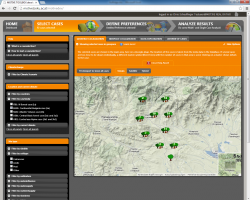
- First Step – Case Selection for further analysis based on meta data from the database
-
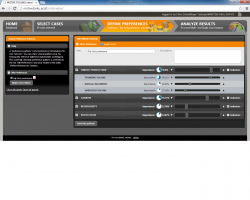
- Second Step – Define Preference(s) by selecting and assigning weights to ecosystem services and indicators
-
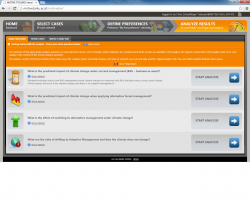
- Third Step – Select the appropriate analysis question to set the “context” for the analysis
-
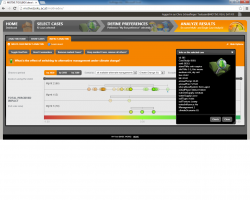
- Fourth Step – Analyze the results (impacts) by selecting different criterias (management scenarios, climate change scenarios, etc.)
-
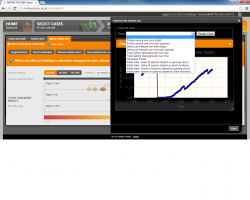
- Charts – Additionally there are several chart visualizations available within the tool.