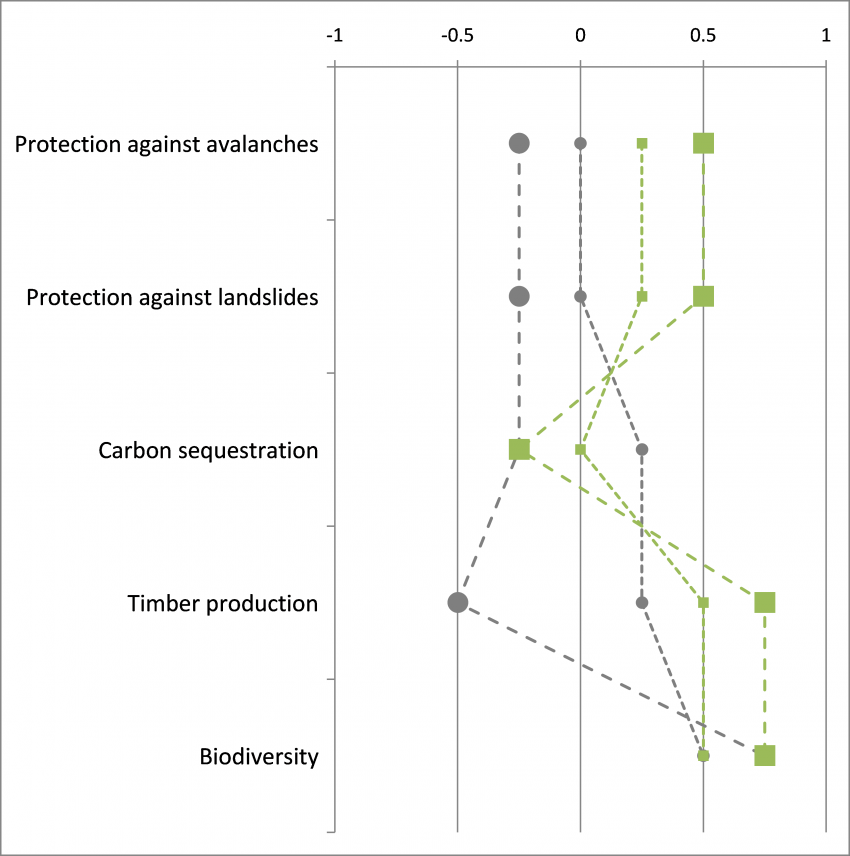
Figure MO-5: Qualitative performance profiles of current management (grey circles) and recommended management (green squares) under climate change. The smaller symbols represent the midterm period from 2020 to 2050, the large symbols represent the second half of the 21st century. Especially for the second half of the century strong differences between current and recommended adaptive management can be expected.