The Optimization Tool searches for an optimal management plan for a forest management unit.
Required input for this tool includes (i) a list (and map) of stands in your management unit, (ii) a number of simulated alternative treatment schedules for each of the stands which quantify the outcomes of the respective management in terms of relevant decision variables.
The Tool produces an optimized plan that assigns a treatment plan to each of the stands in a unit.
Learn more about the tool “OPTIMIZED MANAGEMENT PLAN” here
Conceptual Approach
The Optimal Management Plan tool (OMP) tool assigns one of the available management options to each stand entity to optimize the objective function at landscape level while meeting constraints (e.g. even flow constraints). Based on previous work presented by Falcão and Borges (2005) and Garcia-Gonzalo et al. (2013), this tool is designed to formulate forest management problems in mixed integer programming (MIP). Further it presents a graphical user interface allowing an easy definition of the objective function as well as the constraints.
Generally, forest management models require the generation of mathematical programming matrices to describe the decision problem (e.g. Bettinger et al., 2009). Thus, this tool reads outputs from simulators (e.g. harvest volumes, financial data) and creates the coefficients for all needed equations in the problem formulation. The structure of the files with the generated matrices was designed to adjust to the requirements of the MIP solvers.
Technically, the MOTIVE Optimal Management Plan tool consists of a web based user interface embedded into the MOTIVE ToolBox frame and the factual optimizer component (Optimizer) which is hidden from the user and executed behind the scenes. The two parts of the application communicate via control and data files. The GUI presents the available options to the user and translates the chosen values into a control file that can be parsed by the optimizer component. The data for the optimization is extracted from the MOTIVE DataBase and aggregated to the desired level and then written to a data file. The optimizer core component reads both the control and the data files and prepares the equations for the solver which subsequently tries to mathematically solve the problem. In case of success, the resulting mapping of stand treatment programs to stands is stored in a file which is then loaded by the GUI component of the tool. Since optimizations may require a longer calculation time, a “job queue” was implemented. While optimizations are executed in the background, the user can continue to define new optimization tasks or view results.
This setup required some special technical preparations:
The optimizer kernel runs both on Windows and Linux computers allowing for simultaneous use on web servers (web servers are usually Linux servers) but also in a local installation (which usually is based on Windows).
The solver component of the optimizer package (solving the linear equations) that is used for the product is an open source component (GLPK) that can be freely distributed
LITERATURE
Bettinger P, Boston K, Siry J, Grebner DL. 2009. Forest Management and Planning. Academic Press, New York. 331 p.
Falcão, A., Borges, JG. 2005. Designing decision support tools for Mediterranean forest ecosystems management: a case study in Portugal. Annals of Forest Science 62: 751-760.
Garcia-Gonzalo, J., Palma, J., Freire, J., Tomé, M., Mateus, R., Luiz Carlos, E., Rodríguez, Bushenkov, V., Borges, J.G. 2013. A decision support system for a multi stakeholder’s decision process ina Portuguese National Forest. Forest Systems (doi: 10.5424/fs/2013222-03793).
Usage hints and guides
In contrast to other tools of the ToolBox, the OMP is considered as an expert tool only, because the application of optimization technique per se requires some profound knowledge of the methods. Notwithstanding, the graphical user interface of the tool is designed for easy and visually pleasing use. The parameters for the optimization consist of specifying the objective function as well as flow and target constraints. Additionally, the user can specify the length and the number of periods and economic parameters such as interest rate or harvesting costs and revenues.
The results of an optimization can be viewed and analyzed as a summary, or as more detailed table view. The tool also contains an option to visualize results on top of a Google Maps rendered map. The map view shows the selected prescriptions (for each climate scenario) as colored polygons. The user can even quickly assess the effect of climate change on the results of the optimizer: a map shows how many different prescriptions have been selected by the optimizer for the analyzed climate scenarios, thus highlighting areas with diverting results.
Quick tour
- Select one of the available data set for the optimization (SELECT DATA SET).
- Define the forest stands for the tool (out of all stands of the data set) – the simplest case is to use all cases.
- Select an objective function: Here you select the indicator to maximize/minimize and the periods for the optimization (e.g., Maximize Net present value in 10-years periods). If you use monetary units (NPV), you need to provide interest rates and costs/price (at least for “all other species”).
- Click on “Start Optimization”: a optimization job is created and enqueued. You get notified when the job is finished. Results of finished jobs can be viewed in the “ANALYZE RESULTS” section – check out the various result panels and the export feature.
Screenshots
-
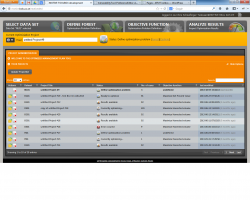
- Optimization Project Administration: Load or delete previous projects and show optimization logs
-
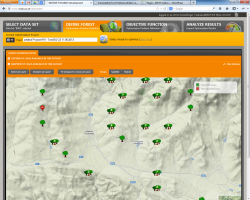
- Select the forest data (stands) for optimization (either by editing a map- or list-view)
-
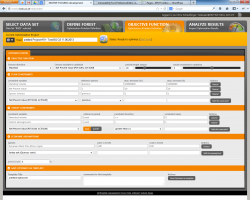
- Define the objective function and constraints for the optimization
-
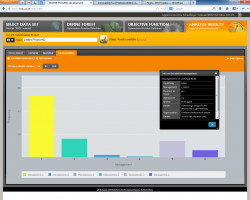
- View and export the results of the optimizer